FeatureX: An Explainable Feature Selection for Deep Learning
Feature selection, as a data preprocessing method, is of great significance in reducing dimension disaster and improving model performance. However, the majority of feature selection methods lack explainability when selecting features. When one feature is prioritized over another, few techniques provide quantitative information about this selection. Furthermore, existing feature selection techniques require users to provide corresponding thresholds or parameters to drive algorithm execution. However, in most cases, it is difficult for users to determine the optimal threshold or parameter for the current task. To address these problems, this paper proposes an explainable feature selection method called FeatureX.
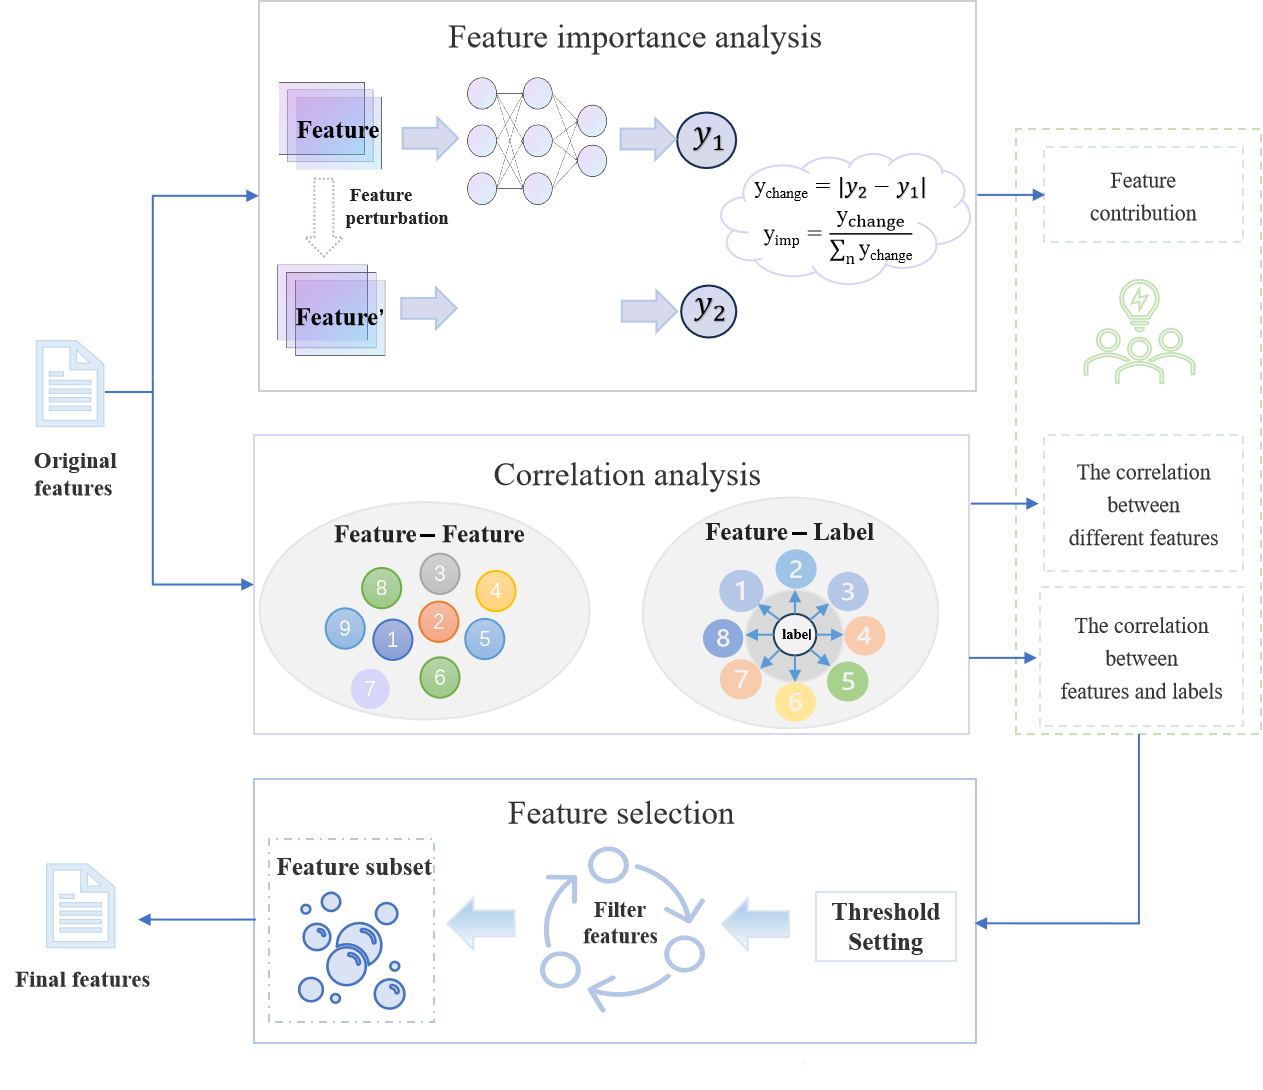
An overview of FeatureX is depicted in Figure 1. On the one hand, feature importance analysis is carried out via feature perturbation. The contribution to the model for each feature is calculated based on the changes in the model prediction results before and after perturbation. On the other hand, correlation analysis is employed to evaluate the potential relationship among distinct features as well as between features and labels. Correlation metrics are used to calculate correlation coefficients among variables. During the feature selection process, the quantitative information of each feature is calculated based on its contribution and correlation coefficient. A threshold value is automatically determined to identify the relevant feature and the feature with the highest contribution value. Finally, the features are prioritized to obtain the best feature subset.
FeatureX combines feature perturbation, feature importance analysis, and statistical analysis to filter features. It also designs a feature importance analysis method based on feature perturbation to quantify the contribution value of features to the model. With the feature contribution and correlation coefficients, FeatureX screens these features to automatically identify the most relevant and high-contribution features. The experimental results show that the number of features is reduced by an average of 47.83%, and 63.33% of the models illustrate an improved accuracy compared to the previous one.
Each component of FeatureX
Feature Perturbation
We show the feature perturbation of FeatureX as the following code.
1y_list = [[] for _ in range(len(column_names))]2interval = [i / 10 for i in range(11)]3rel_out = np.argmax(init_val,axis=1)
1 for j in range(len(column_names)):
     if min_value_list[j] == 0 and max_value_list[j] == 1 and values_count_list[j]!=2:
         values = [interval[i] for i in range(11)]
     elif -0.5 < max_value_list[j] < 0.5 and -0.5 < min_value_list[j] <0.5:
         intervals = (max_value_list[j] - min_value_list[j])/values_count_list[j]
         num_partitions = int((max_value_list[j] - min_value_list[j])/intervals)
         values = [min_value_list[j] + k * intervals for k in range(num_partitions)]
     elif (max_value_list[j]-min_value_list[j])/values_count_list[j] > 100:
         values = [x_list[j][i] for i in range(len(x_list[j]))]
     elif len(x_list[j]) > 10000:
         num_partitions = 1000
         step = (max_value_list[j]-min_value_list[j])/num_partitions
         values = [min_value_list[j] + k * step for k in range(num_partitions)]
         x_list[j] = values
     else:
         values = [i for i in range(int(min_value_list[j]), int(max_value_list[j]) + 1)]
1rel = model.predict(modified_x)2variety = rel - init_val3first_value = variety[0][rel_out]4y_list[j].append(first_value)
Correlation Analysis
We show the correlation analysis of FeatureX as the following code.
1Feature_correlation_list = []2correlation_matrix, _ = spearmanr(spearmanr_data, axis=0)
1target_variable_list = []2unique_values, counts = np.unique(target_variable.values, return_counts=True)
1 if unique_values.shape !=(2,):
	for feature in column_names:
	    point_biserial_corr, p_value = spearmanr(df[feature], target_variable)
	    feature_dict[feature]['target'] = point_biserial_corr
	    target_variable_list.append(str(f"{feature} - target_variable: {point_biserial_corr:.2f}"))
  else:
	for feature in column_names:
	    point_biserial_corr, p_value = stats.pointbiserialr(df[feature], target_variable)
	    feature_dict[feature]['target'] = point_biserial_corr
	    target_variable_list.append(str(f"{feature} - target_variable: {point_biserial_corr:.2f}"))
Feature Selection
We show the feature selection of FeatureX as the following code.
1 for metric in F:
    if feature_dict[metric]['change_range']<0.1:
        F_copy.remove(metric)
    elif 0.1 < feature_dict[metric]['change_range'] <0.5 and -0.3 < feature_dict[metric]['target'] < 0.3
    	and feature_dict_copy[metric]['NOFR'] > 0:
        for i in Rela_class_copy:
            for j in i:
                if metric == j:
                    flag == 1
                    change_range = [feature_dict[feature]['change_range'] for feature in i]
                    max_change_range = max(change_range)
                    max_feature = [feature for feature in i if feature_dict[feature]['change_range']
                    == max_change_range][0]
                    for feature in i:
                        feature_dict_copy[feature]['NOFR'] = 0
                        if feature != max_feature:
                            if feature in F_copy:
                                F_copy.remove(feature)
                    break
            if flag == 1:
                break
        flag = 0
FeatureX Dataset
The source part of the dataset is available at the following URL dataset
FeatureX compares models and data
The code and dataset for the FeatureX feasibility comparison experiment are available at the following URL FeatureX compares models and data